(Manifesto, part 1: Approaching data starts from structure)
Picture books, alongside graphic novels and comics, are the most visual form of literature. They are a literature of pictures. Picture books are often referred to as a means to introduce children to the visual cultures of our societies. “From very early on, we both intuit and learn the language of pictorial representation, and most modern adults, the picturebook was our first dictionary of this visual vocabulary,” writes Maria Popova in her article A Brief History of Children’s Picture Books and The Art of Visual Storytelling in the Atlantic.
Professor of children’s literature at the University of Bologna Giorgia Grilli mentions the year 2010 as a significant point in time for the New Nonfiction Picturebook. It’s when the genre became more popular, and the books started to evolve into something different than they were before. In the new nonfiction picture book, illustration is at the forefront and is in a more important role than ever before. The books might come in larger formats than before. They might entirely be structured around a visual idea, and text is in service of pictures, and not the other way around.
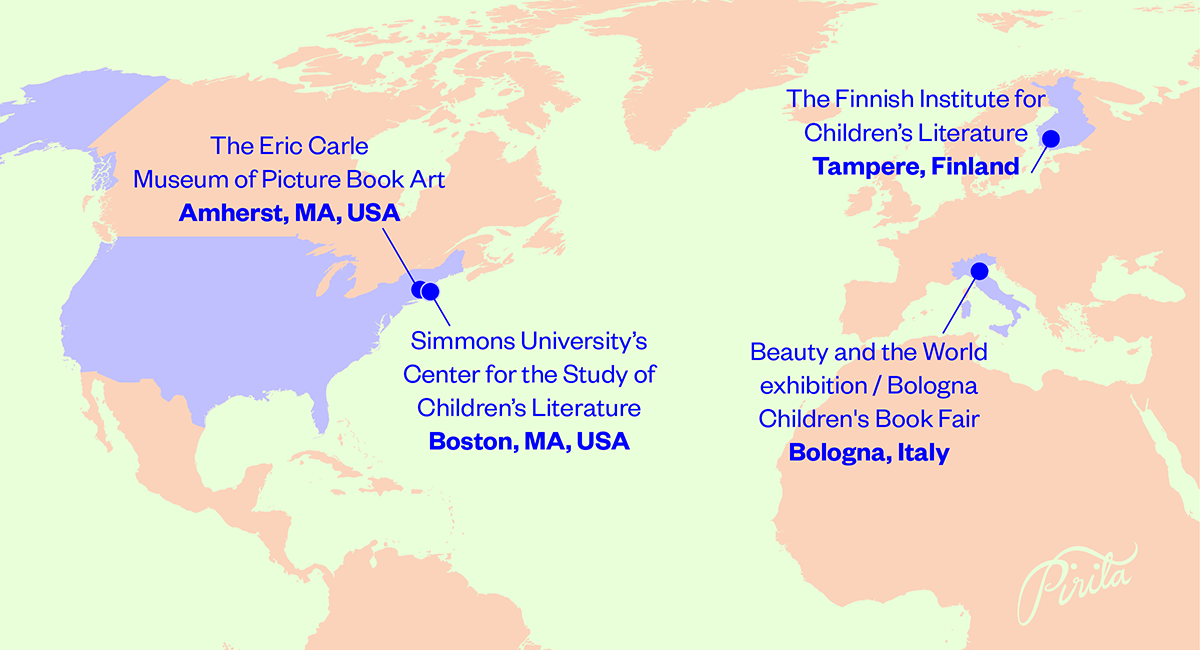
Grilli led a three-year research project at the University of Bologna focusing on nonfiction picture books that ran from 2017 to 2020. The main outcomes were a collection of critical essays Non-Fiction Picturebooks – Sharing Knowledge as an Aesthetic Experience (2020), and an exhibition of nonfiction picture books, Beauty and the World, held in Bologna during spring 2023.
Grilli writes in her article Re-Enchanting the World. The New Non-Fiction Picturebook:
“Since the development of modern science, the real world in Western culture has been identified with what can be analytically demonstrated and logically (i.e. verbally and mathematically) expressed. This has led to knowledge having traditionally been disseminated mostly with words and/or numbers, the tools of reason. The new non-fiction picturebook, however, uses an impressive and original visual code to re-present the world, thereby prompting intuitive insights and emotions, inducing the reader to accept vagueness and mystery and take on board aspects that defy unequivocal understanding or definition. For this is exactly what images do, especially art images. They leave space for interpretation, point to many possible meanings, and present open-ended rather than conclusive reflection.”
The researcher Nikola von Merveldt describes in her article Presenting the Animal Kingdom: Survival Traits of Non-Fiction Picturebooks in the Digital Information Age the change into the new nonfiction picturebook as a qualitative one, not merely a transfer from text to pictures. The whole approach is different, and that has widened the audiences from just children to the entire family.

An apt example of a new nonfiction picturebook is À Toute Vitesse / Full Speed Ahead (2013) by Cruschiform. The book compares the speeds of animals, modes of transport and forces of nature in a simple and intuitive way. The speed is presented on the left side of the spread, and on the right are the illustrations. The textual clarifications can be found on the lower left page.
From the perspective of information or data, there are a lot of arguments for pictures to come first and text second. Vision is our strongest sense. “Humans are specifically skilled in handling visual perceptions, hence pictorial information is understood easily”, writes the Finnish associate professor of statistics Vesa Kuusela in his book Tilastografiikan perusteet (2000), a seminal book on statistics.
We also remember pictures better than text. I remember arriving home from school in the 90s in Kuopio, Eastern Finland, and telling my father of a map I had seen – about how Finland, too, had been behind the Iron Curtain. My father was baffled and a historical monologue followed explaining otherwise. The culprit was more likely the result of a mistaken printer, than the Finnish school system or historical revisionism – but, alas, I can still vividly recall that map, where the border of the Iron Curtain ended and the presence of my country within its borders.
In a study by Evelyn Arizpe and Morag Styles, children reading picture books were interviewed. A five-year-old named Amy commented in an interview:
“I always remember pictures. I sometimes forget words.”
In a visualization it is possible to show a larger scope of information and more content, than through text or numbers. A good example of this is when depicting time.

The numerical information is the most exact and objective. The visual form, clock face, delivers the information fastest, subconsciously and inexactly. The visual form also reveals the most information: a clock face resembles the turning of the day, and the time’s location on it.
The person who makes the visualization need not comment on the matter of how much is a lot, whereas with textual information it rarely can be avoided. “The written text feels to be devoid, if this matter is not addressed. In fact that (how much is a lot) ought to be one of the essential messages of the text, because for mere listing of numbers or other factual information, written text suits poorly”, Kuusela writes.
Kuusela talks about presentations that contain visual, textual and numerical information, and based on the qualities mentioned so far – speed, subconsciousness, better memory – he thinks the visual form ought to be given the most weight when planning.
Picture book illustrators tend to have a good grip on communicating with pictures and text together side by side, also known as iconotext. Both affect the interpretation of one another. They can communicate symmetrically, each telling the same thing, or then the other can take the lead. When text leads, pictures can enhance or elaborate. When pictures lead, text enhances usually by explaining the things we see in the pictures.

The concept of data visualization can feel distant from children’s literature and its makers. I want to bring these two worlds closer to one another, because they have a lot in common. They are both visual worlds. They are both worlds of information, and children’s picture books are perfect platforms for data visualization.
In a picture book story, pictures have a specific role in driving the readerforward: to make them turn the page, to keep them in the thrall of the pictures. In her article Kuvakirjaa tutkimassa, Finnish researcher Mirja Nieminen describes this an imbalance natural to picture books; used to create a sense of change and movement forward.
In nonfiction illustration, the same qualities – rhythm, balance and imbalance – of pictures can be used to communicate something else: to invite a pause to marvel at the most important piece of information. Or to encourage comparing different pieces of data. Or to follow a line to understand its significance in communicating a trend from bad to worse – and then, maybe, towards something more positive.
Data visualization is an interplay of pictures and text, like picture books, but data more often than not points to numbers. When I wanted to talk about numbers and data visualizations in nonfiction picture books, iconotext wasn’t enough. Something was missing. I had to start adding.

The triangle is a tool for adding numerical information to a picture book. It helps to visually consider and balance the ways of communication: what is to be seen and how. Each tip of the triangle refers to the primary means of communication, and symmetry, in the middle of two, means that both are visible and telling the same thing.
The eye icon in the visual tip of the triangle is bigger, since we are talking about picture books and data visualization: visibility, of sight and vision, is our main point of interest.
When we are talking about children as an audience, text as well as numbers will most likely be read out loud. Hence the icons of ears next to verbal and numerical. Text is usually read first, that’s why the ear is bigger, and the numerical information more often than not comes second in hierarchy.
It is rare to communicate the same information through all of them – numbers, visuals and text – but let’s not rule that out. There might be cases with educational purposes or plain communication where it could be needed. For those cases the triangle is a good tool, too.

If we look at this spread from Lifetime: The Amazing Numbers in Animal Lives by Lola M Schaefer & illustrator Christopher Silas Neal (2013) through the triangle, we see illustration, text and numbers. The main message, alpaca and its 20 different fleeces, is told primarily visually, but we can see the numerical info of 20, too, as a part of text. So there is symmetry between visual and numerical, but I would still place this closer to the visual tip of the triangle, since the visual presentation of 20 fleeces covers nearly the whole spread.
Text is symmetrical with the illustration with the information on alpaca and the fleeces. Text enhances by telling the information about one lifetime, and the illustration enhances by showing how the fleeces are shorn from the alpaca.
Lifetime’s idea is very visual, as suits a picture book, and its structure is not linear. You can basically start reading Lifetime anywhere, which is not unusual for nonfiction picture books with an expository structure. Picture books can be viewed as drama: they are often read out loud while each spread stands for a new scene with a new set of props, and this idea of new scenes (and new actors!) on each spread suits Lifetime very well.
Often the spreads showing quantities (especially large quantities) imply a stop in the movement, and hence a calm and steady rhythm. Still with Lifetime you want to turn the pages and see the next visualization, but there is no urgency.
Illustrator-author Uri Shulevitz writes in his book Writing With Pictures – How to Write and Illustrate Children’s Books (1985):
“Visual thinking can also help a writer to avoid excessive wordiness.”
Visual thinking is especially useful with numbers. In addition to picture books, the triangle is present often in my client work as an Information Designer. I use the term visual dimension to depict that things that have it (a clear visual dimension) should be communicated visually whenever possible. A simple example of this was shown in the Manifesto’s part 1: the concept of five kinds of nonfiction. That concept has a clear visual dimension – the amount of five. When the different kinds of nonfiction, five of them, are visualized, there isn’t a need to show the number at all.
One of the main points of the triangle is the movement upwards, towards the visual, and to question whether to show verbal or numerical information at all – of those things that can be visualized. It is not always necessary to show the numbers, and this is good news for people with a dislike for them. Visualizing numbers often means you don’t need to show them. The beholder doesn’t need to make sense of them, because the book maker has already done it.
We have a tradition of linking information and knowledge with words and numbers, and it overshadows the potential of visuality. Whereas in picture books numbers traditionally haven’t been a core element of communication. If we want to bring these two together, to add data visualization to picture books, we need to envision a numerical means to visual-verbal interaction. All the information – visual, verbal and numerical – needs to be utilized in a way that suits them best; and they all have sources that need to be identified and included in the back matter.
Proofreading: Ed Nawotka
This was my Manifesto’s second part, and here you can read the first. Interested in the third, right straight to your inbox? Subscribe to my newsletter!
Sources:
- Maria Popova: A Brief History of Children’s Picture Books and The Art of Visual Storytelling / Atlantic (24.2.2012)
- Giorgia Grilli: Re-Enchanting the World. The New Non-Fiction Picturebook (p. 18) in Giorgia Grilli (edited): Non-Fiction Picturebooks. Sharing Knowledge as an Aesthetic Experience, Edizioni ETS (2020)
- Nikola von Merveldt: Presenting the Animal Kingdom: Survival Traits of Non-Fiction Picturebooks in the Digital Information Age (p. 119-120) in Giorgia Grilli (edited): Non-Fiction Picturebooks. Sharing Knowledge as an Aesthetic Experience, Edizioni ETS (2020)
- Vesa Kuusela: Tilastografiikan perusteet (p. 13-14), Oy Edita Ab (2000)
- Evelyn Arizpe & Morag Styles: Children reading pictures: interpreting visual texts (p. 77). Routledge (2003)
- Mirja Nieminen: Kuvakirjaa tutkimassa (p. 32). in Kaisa Laaksonen (edited): Johdatus lastenkirjallisuuden tutkimukseen, Lastenkirjainstituutin julkaisuja 35 (2022)
- Pirita Tolvanen: Visual Workflows of Nonfiction Picture Books / Illustrating Data (10.2.2023)
- Uri Shulevitz: Writing With Pictures – How to Write and Illustrate Children’s Books (p. 10), Watson-Guptill Publications (1985)
- Joanne Golden: The narrative symbol in childhood literature: explorations in the construction of text. Mouton de Gruyter (1990)
- Martin Salisbury & Morag Styles: Children’s Picturebooks – The art of visual storytelling, Laurence King Publishing (2012)
- Maria Nikolajeva & Carole Scott: How Picturebooks Work, Routledge (2001)