Tag: infographics
-
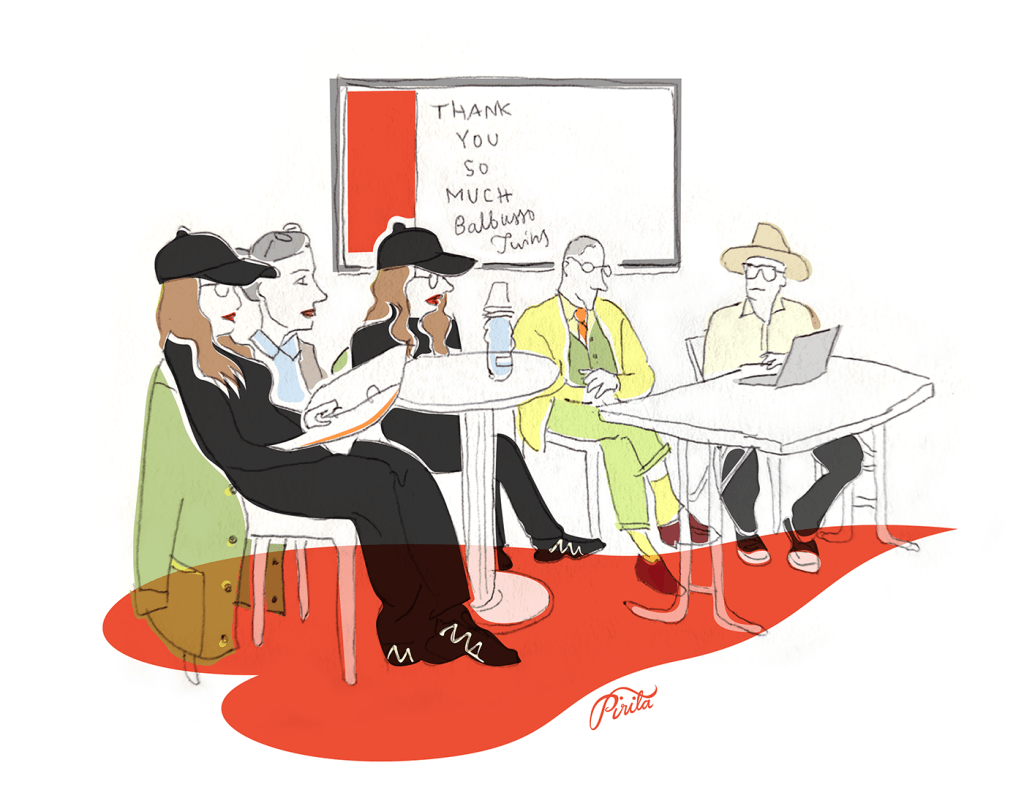
Bologna 2026: AI, Isotype and drawing reality
I gave a masterclass talk Drawing Reality: Authenticity and New Conventions in the AI Era on April 13th at the Bologna Children’s Book Fair (BCBF) in Bologna, Italy. For me, the masterclass was an important summary of themes I’ve been passionate about for a long time. My main argument was…
-
Manifesto, part 3: With data, we need pictures
In Manifesto’s part 1, I wanted to show how expository nonfiction can be a way to approach data visualization on a structural level, with an example of nonfiction illustration’s direct, straightforward way of communicating. In Manifesto’s part 2 I focused on the New Nonfiction Picturebook and added a numerical dimension…
-
Manifesto, part 2: In a picture book, pictures come first
Picture books, alongside graphic novels and comics, are the most visual form of literature. They are a literature of pictures. Picture books are often referred to as a means to introduce children to the visual cultures of our societies. “From very early on, we both intuit and learn the language…
-
Manifesto, part 1: Approaching data starts from structure
How should one approach data in children’s literature? This manifesto is about introducing data visualization to children’s nonfiction literature. Note: I haven’t written this for children. To reach children, especially with a theme like data, one would have to use pictures more than text—not just to achieve an outcome, but…
-
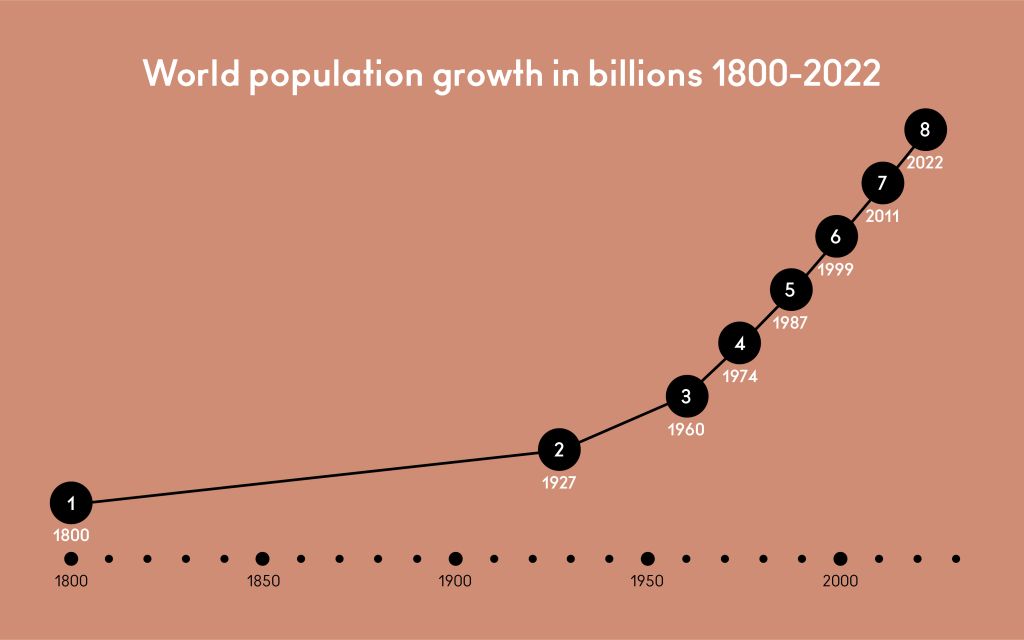
Time: Lines or stories?
Looking through nonfiction picture books in my research I started to notice timelines in which time was not visualized properly. Often, they were events in time placed side by side with or without a line. Like this: It does look like a timeline. But time isn’t actually visualized: it’s numerical…
-
Bologna 2023: Beauty, censorship and data
I gave a masterclass talk on Data Visualization and Nonfiction Picture Books on March 8th, at the Bologna Children’s Book Fair in Bologna, Italy. Thank you everyone who came! I had a focused audience that asked brilliant questions (“Can you show examples of emotional structures in data illustrations?” I will…
-
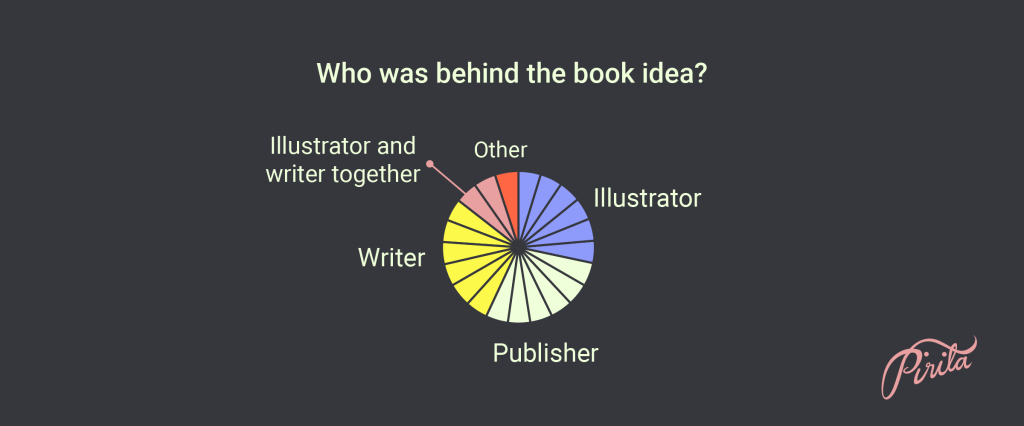
Visual workflow of nonfiction picture books
I conducted a survey for the illustrators, graphic designers and editors of the 23 nonfiction picture books published in Finland in 2021. I wanted to know how the books were made. What was the visual workflow, what were the responsibilities of each professional involved, and maybe as the main question:…
-
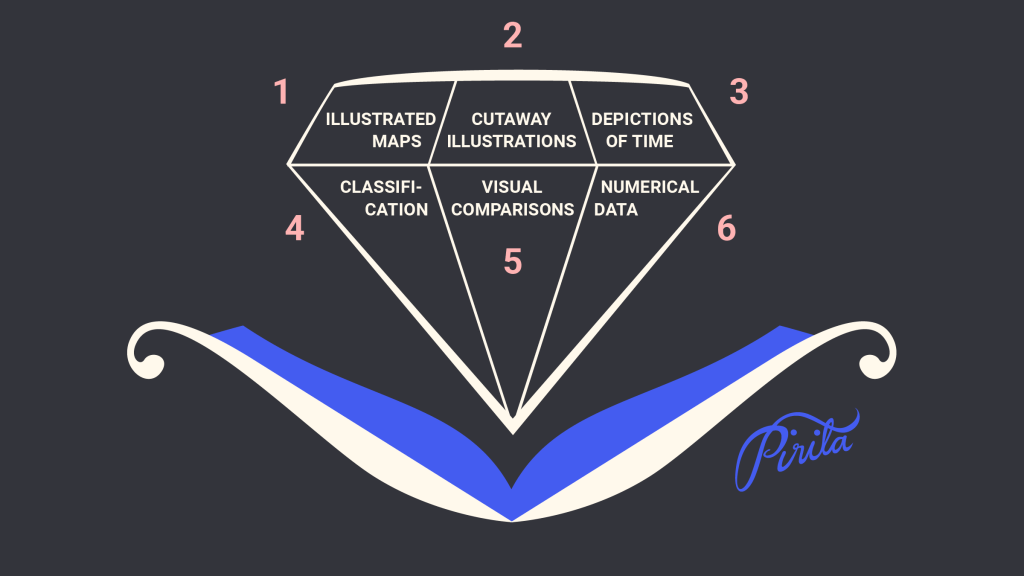
Presentations of data in nonfiction picture books in the U.S.
I spent spring semester 2022 at the Simmons University’s Center for the study of Children’s Literature in Boston, MA, USA as a Fulbright Scholar. My project topic was data visualization and children’s nonfiction picture books. I beheld a lot of nonfiction picture books. I read scholarly and historical material about…
-

Numerical Data
“…many of us are cajoled by the mere presence of numbers and charts in the media we consume, no matter whether we can interpret them well.” Alberto Cairo: How Charts Lie – Getting Smarter about Visual Information Visual representations of numbers and numerical data are the core of my Fulbright…
-

Visual Comparisons
“Never leave a number all by itself. Never believe that one number on its own can be meaningful. If you are offered one number, always ask for at least one more. Something to compare it with.” Hans Rosling: Factfulness: Ten Reasons We’re Wrong About the World – and Why Things…
-
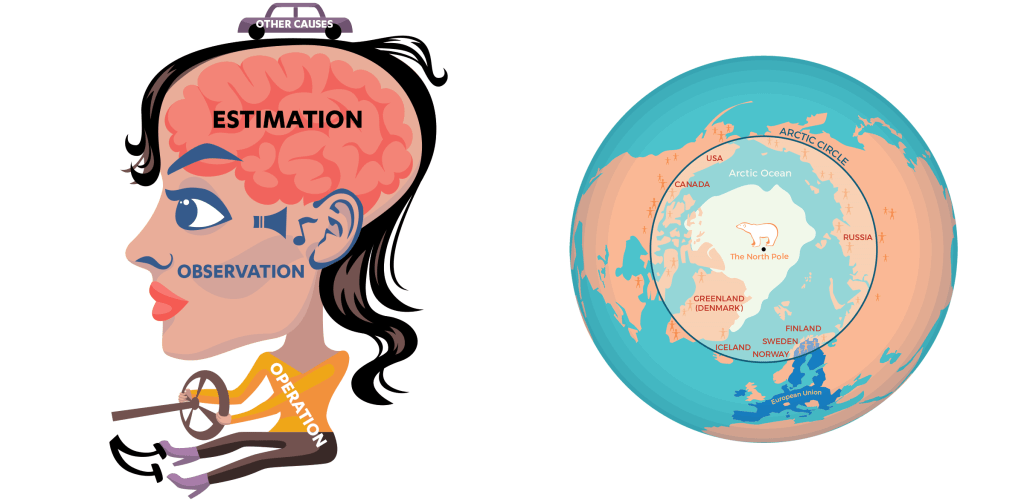
Illustration and text go together
I have been thrilled to learn the terms ‘text-image interaction’ and ‘visual and verbal interaction’ during my Fulbright project – and get acquainted with the talk of them. For some time I had been searching for the best words to talk about this theme: I feel it combines picture books…
-
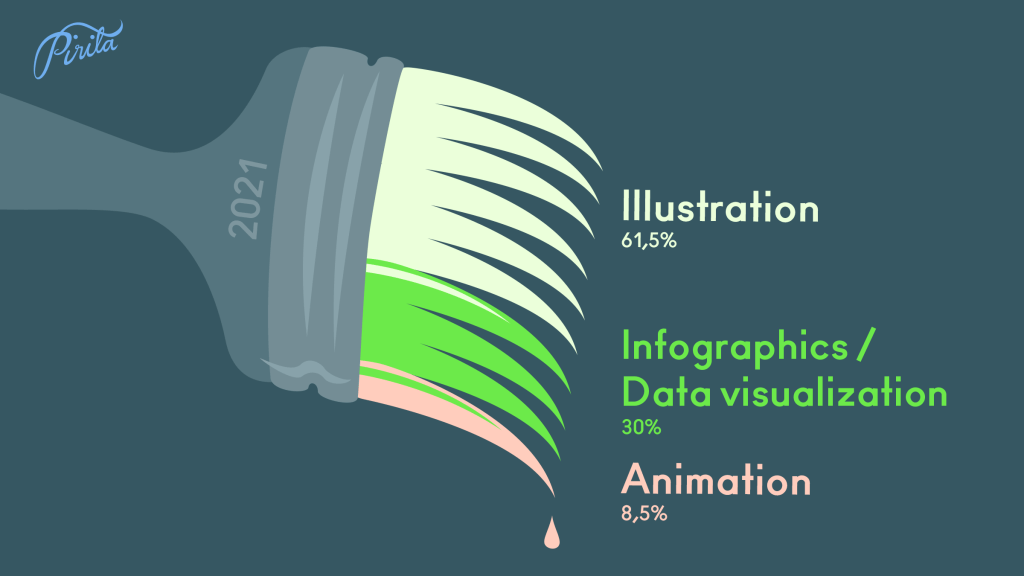
Year 2021 illustrated
I like to follow the balance between my illustration work and infographics/data visualizations. It is not always easy to draw the line, since most of my projects are a combination of both. And not rarely a project that starts out as an infographics commission ends up being an illustration –…
-
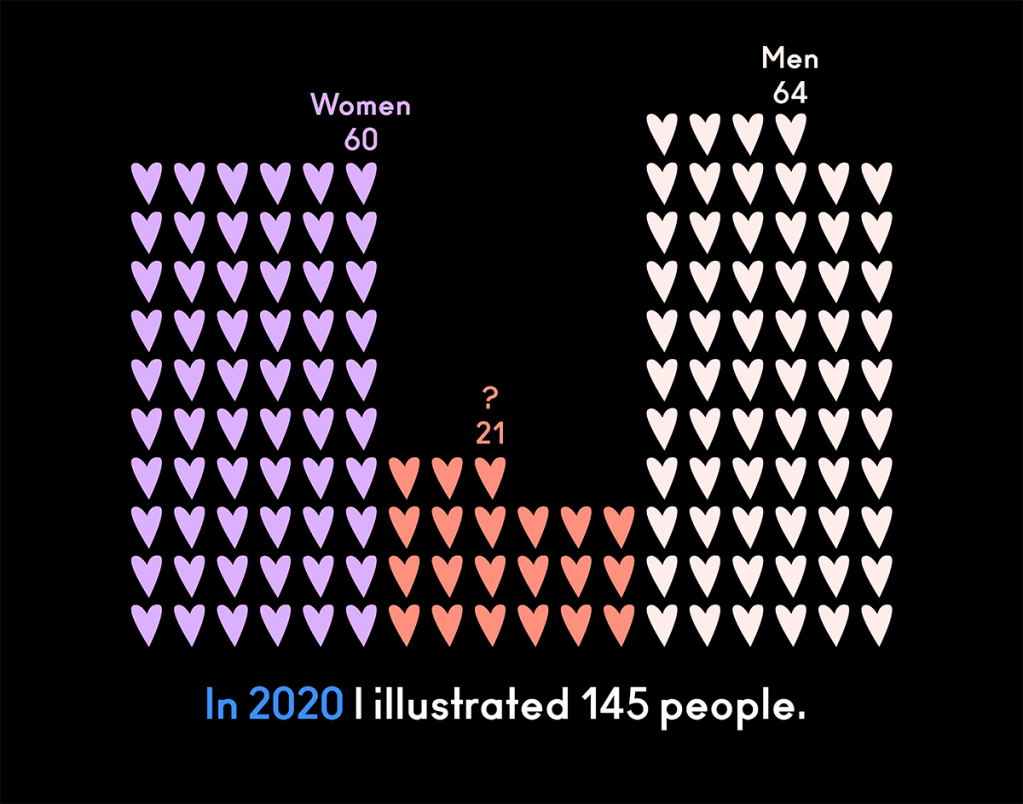
Year 2020 illustrated
My 2020’s numbers illustrated. I did this two years ago, too, and thought it’s time for an update with new numbers of the strange year. Towards new!
-
Simon Sinek
One of my favorite speakers at Nordic Business Forum 2015 was Simon Sinek. “Leaders eat last” was the title of his speech. Couldn’t stop thinking about what and how he spoke about leadership and the chemicals behind our happiness. Go Simon!

