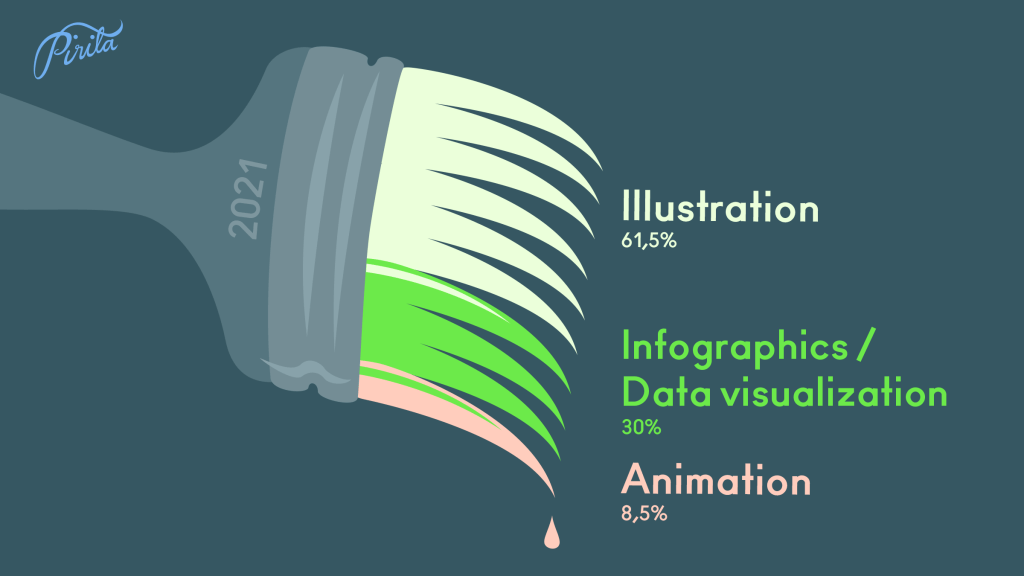

I like to follow the balance between my illustration work and infographics/data visualizations. It is not always easy to draw the line, since most of my projects are a combination of both. And not rarely a project that starts out as an infographics commission ends up being an illustration – with perhaps a very communicative function.
My interest in this balance is one of the reasons why I’ve done these summaries of my years (2018 & 2020). This year I decided not to count the amounts of illustrations or other work pieces like I’ve done before. It was always tricky to do (the projects are so different from one another) and the number didn’t basically tell me anything.
This year I based it on time used.

Book projects are the backbone of my professional year: they take so much time. So they need to be planned ahead and usually still it’s a juggling act on getting it all done on time.
And of course they are important. And of course there are always new ones screaming for my attention.
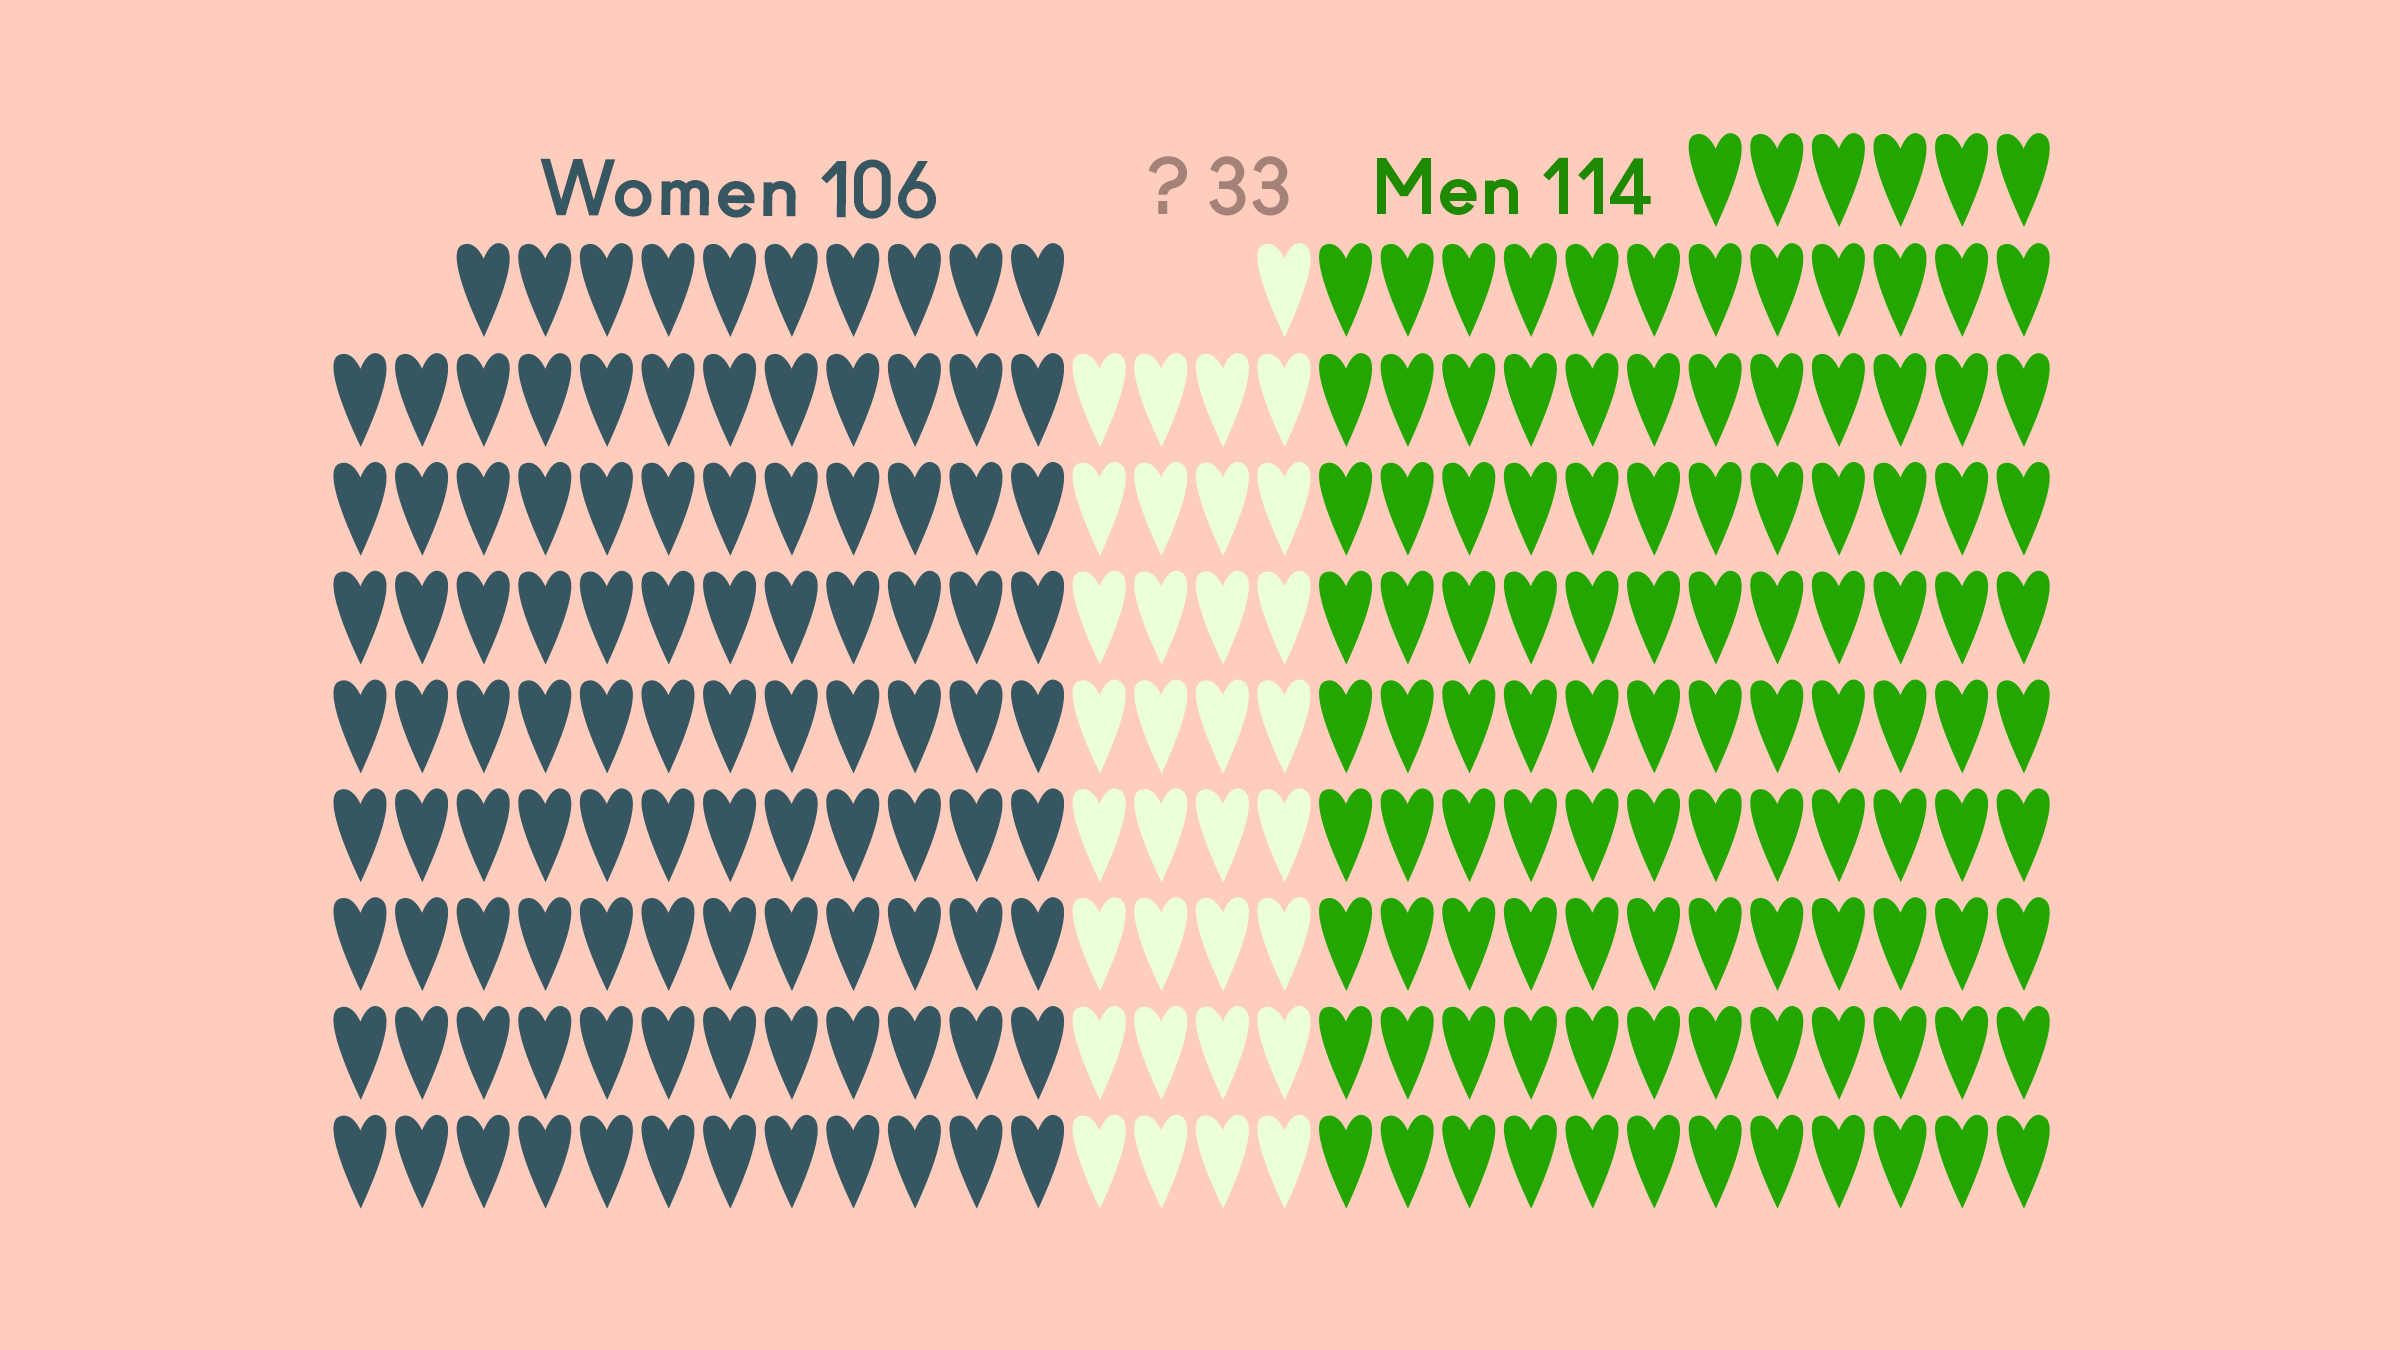
In the previous years I counted only the characters with facial features (2020: 145, 2018: 85). But I often illustrate tiny human figures, and some of them clearly represent a specific gender. So this year I counted all the characters who were more than mere stick figures or something very general.
Illustration is often intertwined with stereotypes in order to communicate, and I believe everyone has moments of bias and blindness. As much as possible I portray non-binary in my characters. It is work-in-progress, always.
Gender equality is important to me especially because I’ve illustrated subjects like rally car racing and motorcycle road racing – traditionally male-dominated. Nowadays it’s time they look different.
These numbers, obviously, are based on how the characters look. I’ve had a fair share of notions about eye lashes on men… perhaps someone else might do the math a little different!
Bye 2021! You and your numbers.

Leave a comment