How should one approach data in children’s literature? This manifesto is about introducing data visualization to children’s nonfiction literature.
Note: I haven’t written this for children. To reach children, especially with a theme like data, one would have to use pictures more than text—not just to achieve an outcome, but as a means for planning and structuring the overall logic of a project. There it is: the basic summary of this manifesto. In this first part I talk about stories, structures and linearity. In the second part I focus on picture books. The third part is about the interaction of pictures and data. And it all comes together in the end with emotions.
My path to this subject started in 2017 when I had my first visit to the Bologna Children’s Book Fair in Italy, and discovered nonfiction picture books. I was deeply fascinated by the form and knew I had found my genre. I was also inspired with the idea for my debut nonfiction picture book, The Flying Finn – Story of Jarno Saarinen during that visit. But I knew I wanted to dive deeper to the world I had discovered than merely through book projects.
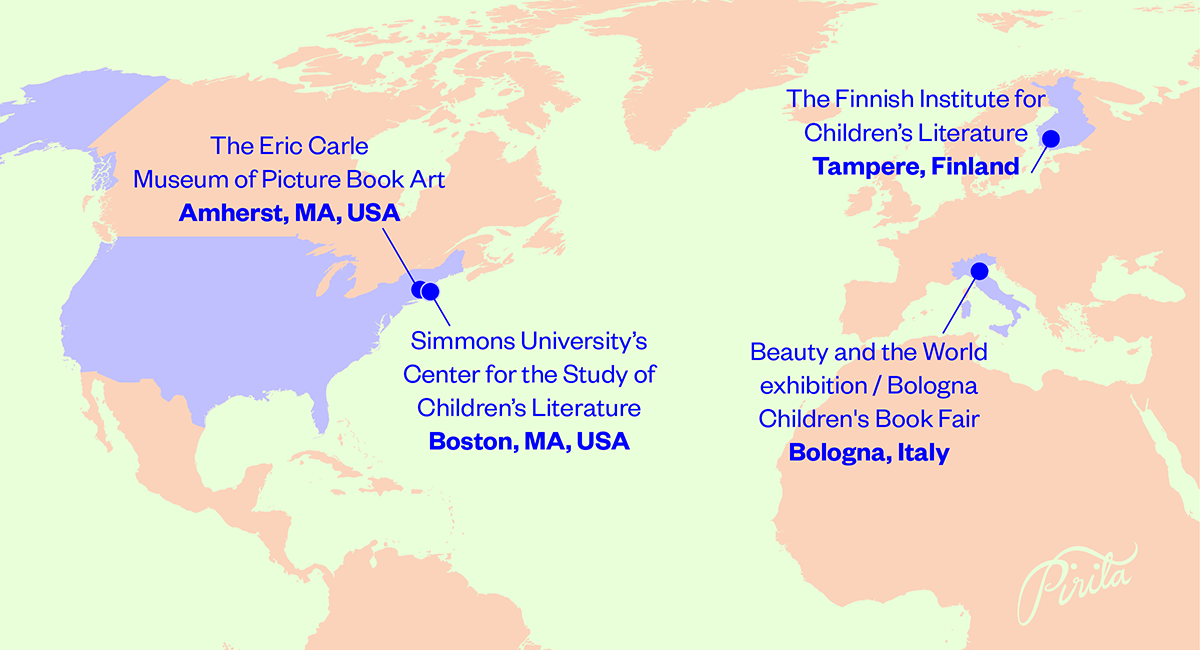
Three years on, an opportunity presented itself in the form of a Fulbright grant program. I put together a grant project that was a combination of nonfiction picture books and illustrating data, the dominant themes and passions of my career so far. I started the project early 2022 at the Simmons University’s Center for the Study of Children’s Literature in Boston, MA, United States. And after that I continued work in Finland, and visited the Bologna Children’s Book Fair again in 2023.
Storytelling with data has been an often heard slogan in recent years. But data has largely been absent from children’s literature which are often focused on narrative. Stories we usually read in children’s books are not about data nor do they show it.
Expository books, on the other hand, aim to explain and inform, and they often focus on explaining specific concepts. One of the most obvious examples of expository books are ABC books, structured on the alphabet (one letter per page), that help you learn and remember the alphabet order. Expository books have a clear connection to visualization and thus to data, as both are in love with structures.
Children’s nonfiction book author Melissa Stewart and Marlene Correia, Assistant Professor of Literacy Education at Bridgewater State College, have challenged the idea that all children prefer stories. “Some children are, indeed, naturally drawn to narratives,” Stewart and Correia write in their book Five Kinds of Nonfiction (2021). ”But,” they observe, ”other children are more analytical thinkers. They’re excited by ideas and information and would rather read expository nonfiction”.
In the book Stewart and Correia divide children’s nonfiction into five different categories. One is narrative and the others have an expository writing style, and are subdivided into four categories: traditional, expository literature, browsable and active.

Typically, children are far more often exposed to fiction than nonfiction in their daily lives. This is especially true in my home country, Finland. Here, where a fifth of all published children’s and young adult’s literature is nonfiction, I can easily find narrative, traditional and expository nonfiction and not so many browsable or active kinds.
Stewart and Correia object to the prioritization of presenting fiction for children and point to research that showed 40% of children, grades one through six, when given a choice of books to check out from a school library, opted for nonfiction titles. Researcher Kathleen A. J. Mohr found in her study Children’s Choices for Recreational Reading (the Journal of Literacy Research, 2006) that more than 80% of first-graders chose nonfiction when invited to choose a book, based on either hearing a text example or being given a choice based on book covers.
Researcher Betty Carter argues in her article A Universe of Information: Future of Nonfiction (HornBook, 06/2000) that even though story is powerful, it only presents a part of our literary tradition.
“If children read only fiction, or nonfiction with strong fictional elements, then they may find themselves forever anchored in the language of childhood, unable to understand and express thoughts and ideas beyond individual experiences,” Carter writes.
In his book Factfulness (2018), Hans Rosling, professor of global health, differentiates a fact-based worldview from an overdramatic, emotion-driven worldview. In the book, he demonstrates how feelings and emotions often lead us astray in the modern world. “We have many instincts that used to be useful thousands of years ago, but we live in a very different world now”, Rosling writes. For example, our interest in gossip and inclination toward dramatic storytelling was more useful back when this was the only source of news and useful information.
According to Rosling, an overdramatic worldview leads people to offer the most dramatic and predominantly negative answers when asked about the state of the world. To counterbalance inclination, he suggests acquiring and implementing therapeutic statistics.
Data is many
In a story, typically illustration depicts the characters and the setting. Fiction illustrators often have character studies in their portfolios, whereas illustrators, who work mostly with nonfiction, have cutaways, anatomical illustrations, diagrams or maps in their portfolios, to name some examples. Where a story traditionally emphasizes linearity, as it is typically depicted as text, pictures are not linear. Instead, “they communicate by codes of shape, colour, texture, symbolism, and juxtaposition; they depend upon complex assumptions about visual conventions”, writes Peter Hunt in his article The World in Pictures (from Illustrated Children’s Books, 2009).
Often the picture’s biggest elements catch the first attention and get “read” first. Sometimes it is a small element (especially a character) on the side that steals the first attention and leaves everything else a far second in the reading order.
Stewart and Correia note, “Expository nonfiction shares ideas and information in a more direct, straightforward way. It often relies heavily on art and design to help convey meaning”.

This spread of Rallitalli, a nonfiction picture book about rally car racing that I’ve illustrated, is a good example of a nonfiction illustration: it is heavy with pictorial, fact-based information. The text runs linear, but does not impose an order in which it must be read. Most likely, everyone will consume the content in a somewhat different order.
The writer of the text, Pasi Lönn, and I researched the book first-hand by working with two different rally racing teams, Toyota Gazoo Racing from Estonia and Grönholm RX from Finland. This work with primary sources meant the data in our book is factual. What is fictive in this picture, are the car’s model and the sponsor logos. They are made up, but both the model and the logos are based on and similar to existing car models and sponsor logos. (A red boar, instead of a red bull, for example.)
Of course, personal style has come into it. In his article The Fact of Joy: Marveling at and in Children’s Non-Fiction (from Non-Fiction Picturebooks: Sharing Knowledge as an Aesthetic Experience, 2020), researcher Joe Sutcliff Sanders reminds us of a core value necessary to reading nonfiction: critical eye. He points out that illustrations
“delivered in a clearly personal ‘style’ might actually be better suited than more neutral styles for reminding readers to engage with the images in their non-fiction critically, as indeed they ought to be engaging with everything.”
A story usually is selected to elicit an emotional response. It is delivered with a distinct narrative arc: emphasizing a rising tension, a climax or denouement and a resolution. But building a book on a different type of structure means you can elicit something else.

Data is plural. Data is many. Storytelling with data means different stories: stories of many, stories that talk about our world here and now, using not just one but countless facts. The amount shifts the perspective. To understand these stories we need to learn new skills of understanding how many, how was it collected, who they are or what they are, and why we are hearing these stories – and they might come with an expository structure.
Taking the story out of the equation does not mean nonfiction books or stories of data are devoid of emotion. In his book Living in Data – A Citizen’s Guide to a Better Information Future (2021) Jer Thorp walks you through his and co-artist Ben Rubin’s permanent public art installation Herald/Harbinger, which started when they placed seismic sensors inside the Bow Glacier 200 km northwest of Calgary, Canada. The glacier data is beamed through a satellite to reach a plaza in Calgary city center. There, the shifts and cracks become light through LED arrays and sounds of ice and water through 16 speakers.
Bow Glacier, like nearly all North American glaciers, is melting. Thorp describes the installation:
“To witness, in data, the death of the Bow Glacier. To play out its last testament not in low, hidden frequencies but aloud, in public, for everyone to hear.”
Herald/Harbinger is a beautiful and emotion-filled example of a story of data, even though I have only experienced it through online videos (like this one). The data stories of the present day, unfortunately, are often concerning matters of urgency and alarm (of which climate change is but one example), that are often depicted in the minor key. But as they are, as long as we see the lights and hear the sounds, we know there is hope.
We don’t think there is hope, or hope there is hope; because of data we know there is, and we know exactly how much.
The emphasis and reliance on narrative and emotion-driven storytelling in children’s nonfiction should be challenged. Story is linear, whereas pictures are not – neither are many books with expository structures. Utilizing expository structures does not mean giving up emotions, nor narrative means. Often expository structures mean relying more on art and pictures.
Proofreading: Ed Nawotka
This was my Manifesto’s first part. Interested in the second and third? Subscribe to my newsletter!
Sources:
- Melissa Stewart & Marlene Correia: 5 Kinds of Nonfiction – Enriching Reading and Writing Instruction with Children’s Books, Routledge (2021)
- Hans Rosling: Factfulness, Hodder & Stoughton (2018)
- Giorgia Grilli (edited): Non-Fiction Picturebooks. Sharing Knowledge as an Aesthetic Experience, Edizioni ETS (2020)
- Duncan McCorquodale, Sophie Hallam & Libby Waite: Illustrated Children’s Books, Black Dog Publishing (2009)
- Jer Thorp: Living in Data – A Citizen’s Guide to a Better Information Future, MCD Picador / Farrar, Straus and Giroux (2021)
- The Finnish Institute for Children’s Literature & Kirjakori: annual statistics of Finnish children’s and youth literature, 2021
- Pirita Tolvanen: Presentations of Data in Nonfiction Picture Books in the U.S. / Illustrating Data (2022)
- Pirita Tolvanen: Visual Workflows of Nonfiction Picture Books / Illustrating Data (2023)
- Kathleen A. J. Mohr: Children’s Choices for Recreational Reading: A Three-Part Investigation of Selection Preferences, Rationales, and Processes / the Journal of Literacy Research (2006)
- Betty Carter: Reviewing Nonfiction Books for Children and Young Adults: Stance, Scholarship, and Structure. from the book: Evaluating children’s books : a critical look : aesthetic, social, and political aspects of analyzing and using children’s books, University of Illinois (1992)
- Betty Carter: A Universe of Information: Future of Nonfiction / HornBook (06/2000)
- Amanda Baker: Nonfiction is cool and our kids know it / Scientific American (3.12.2021)
- Cynthia Levinson, Melissa Stewart & Jennifer Swanson: Hey, Grownups! Kids Really Do Like Nonfiction / Publishers Weekly (7.1.2021)

Leave a comment