How should one approach data in children’s literature?
This Manifesto is about introducing data visualization to children’s nonfiction literature. It comes in three parts.
Part 1: Approaching data starts from structure
In the Manifesto’s first part (published 28.2.2024) I talk about stories, structures and linearity. I show how expository nonfiction can be a way to approach data visualization on a structural level, with an example of nonfiction illustration’s direct, straightforward way of communicating.
And I explain what led me to write this Manifesto.
Read Manifesto’s part 1: Approaching data starts from structure
Part 2: In a picture book, pictures come first
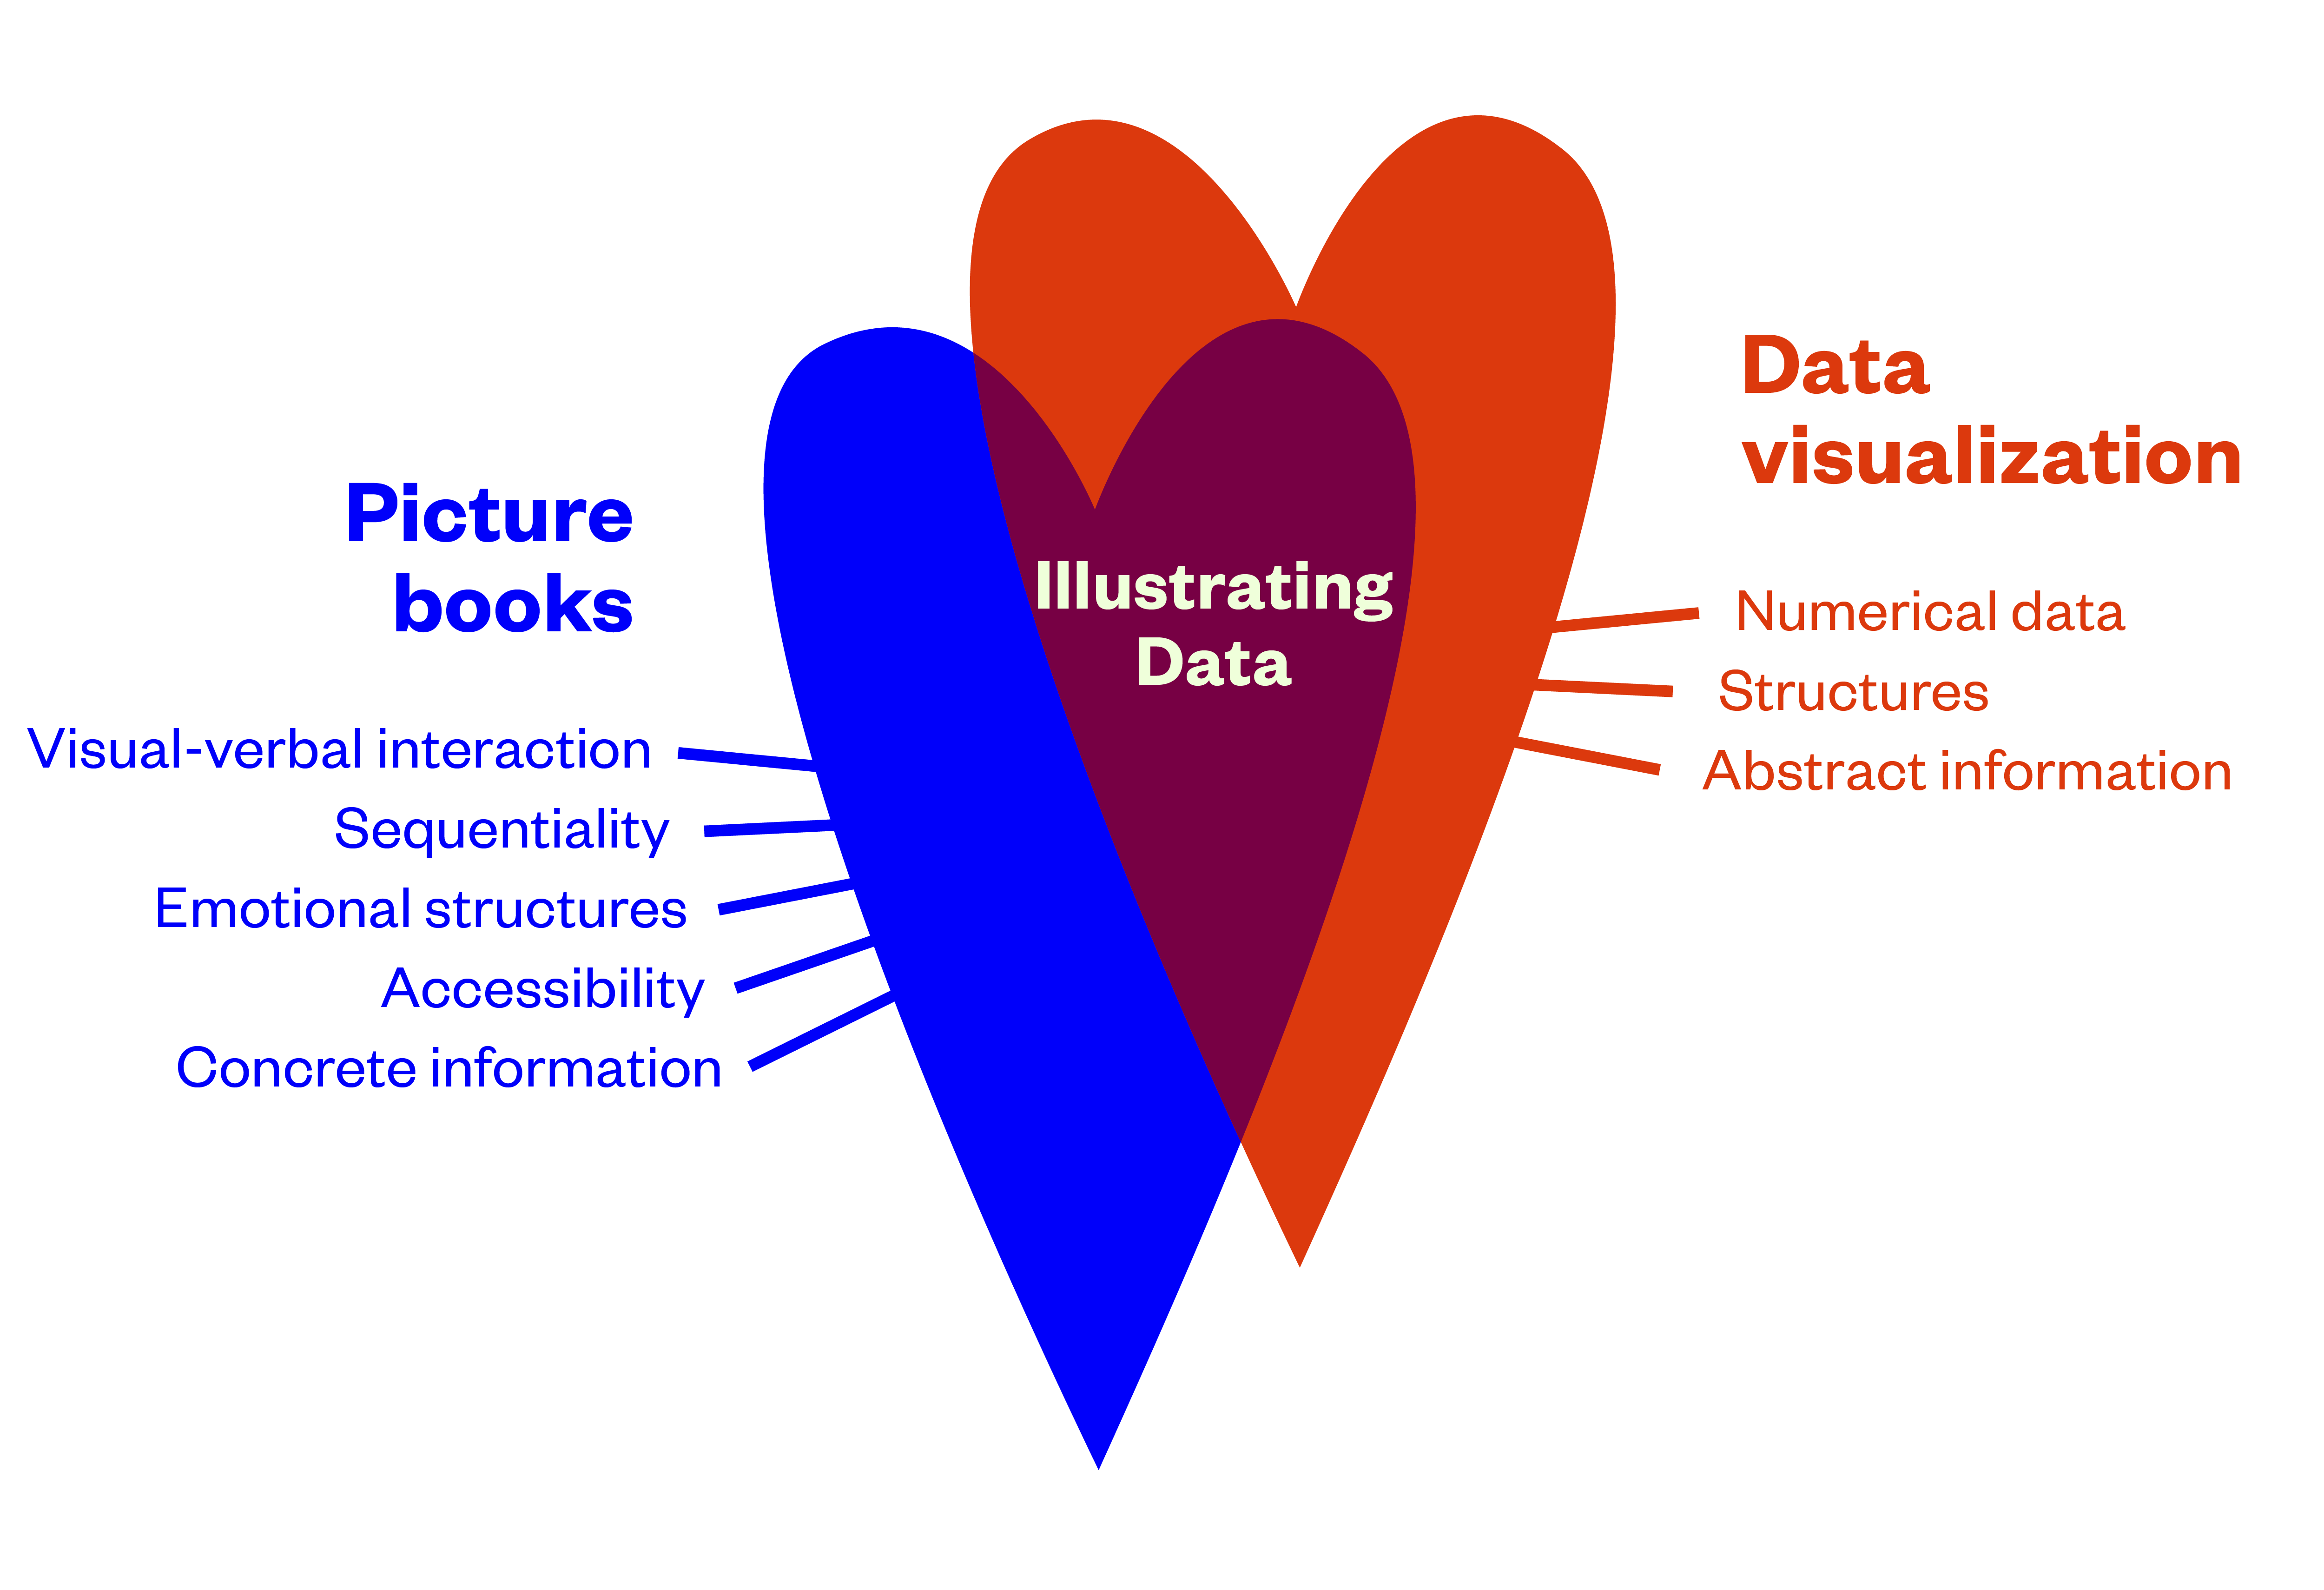
In the Manifesto’s second part (published 8.4.2024) I focus on picture books — especially on the New Nonfiction Picturebook. I add a numerical dimension to the picture book’s visual and verbal communication.
Picture books, alongside graphic novels and comics, are the most visual form of literature. They are a literature of pictures. Picture books are often referred to as a means to introduce children to the visual cultures of our societies.

We have a tradition of linking information and knowledge with words and numbers, and it overshadows the potential of visuality. Whereas in picture books numbers traditionally haven’t been a core element of communication. If we want to bring these two together, to add data visualization to picture books, we need to envision a numerical means to visual-verbal interaction.
Read Manifesto’s part 2: In a picture book, pictures come first
Part 3: With data, we need pictures
The Manifesto’s third part (published 29.5.2024) is about the interaction of pictures and data. And it all comes together in the end with emotions.
Illustration is concrete; illustration is accessible, and it has the potential to be emotionally very powerful. All these qualities make it possible for illustration to grow towards communicating more abstraction — ie. data. We haven’t seen too many examples of that yet. For nonfiction illustrators it might mean learning new skills, but what is needed most of all, is curiosity towards new visual worlds.
Read Manifesto’s part 3: With data, we need pictures