Tag: charts and graphs
-
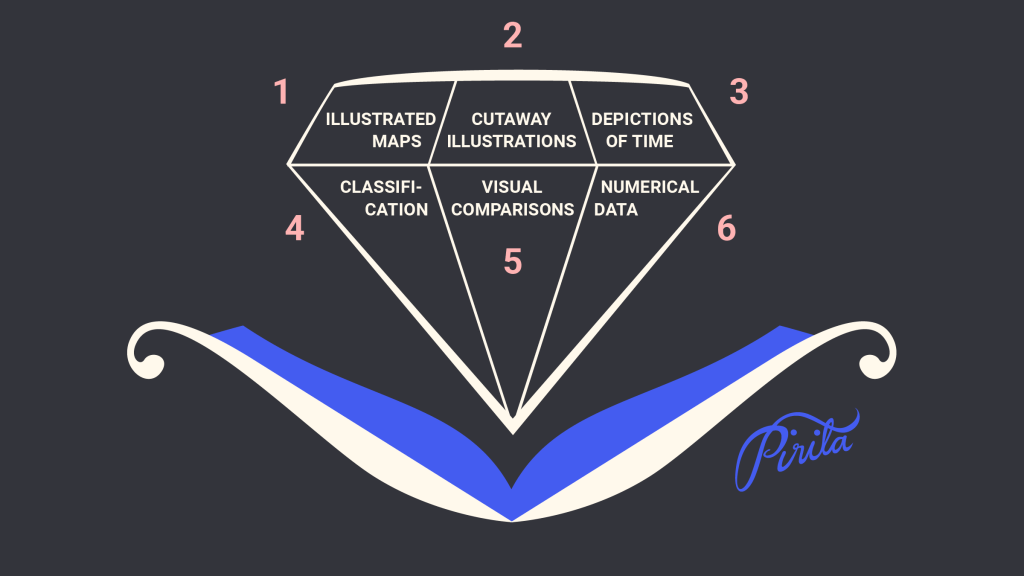
Presentations of data in nonfiction picture books in the U.S.
I spent spring semester 2022 at the Simmons University’s Center for the study of Children’s Literature in Boston, MA, USA as a Fulbright Scholar. My project topic was data visualization and children’s nonfiction picture books. I beheld a lot of nonfiction picture books. I read scholarly and historical material about…
-

Numerical Data
“…many of us are cajoled by the mere presence of numbers and charts in the media we consume, no matter whether we can interpret them well.” Alberto Cairo: How Charts Lie – Getting Smarter about Visual Information Visual representations of numbers and numerical data are the core of my Fulbright…
