Category: Data Visualization
-
Name change: Illustrating Data
This blog used to be called “Cold as Ice Cream”, based on a Blondie song Sunday Girl. It was my visual diary that I started 2015. I will spend spring semester 2022 in Simmons University, Center for the Study of Children’s Literature in Boston, MA, USA, as a Fulbright grantee.…
-
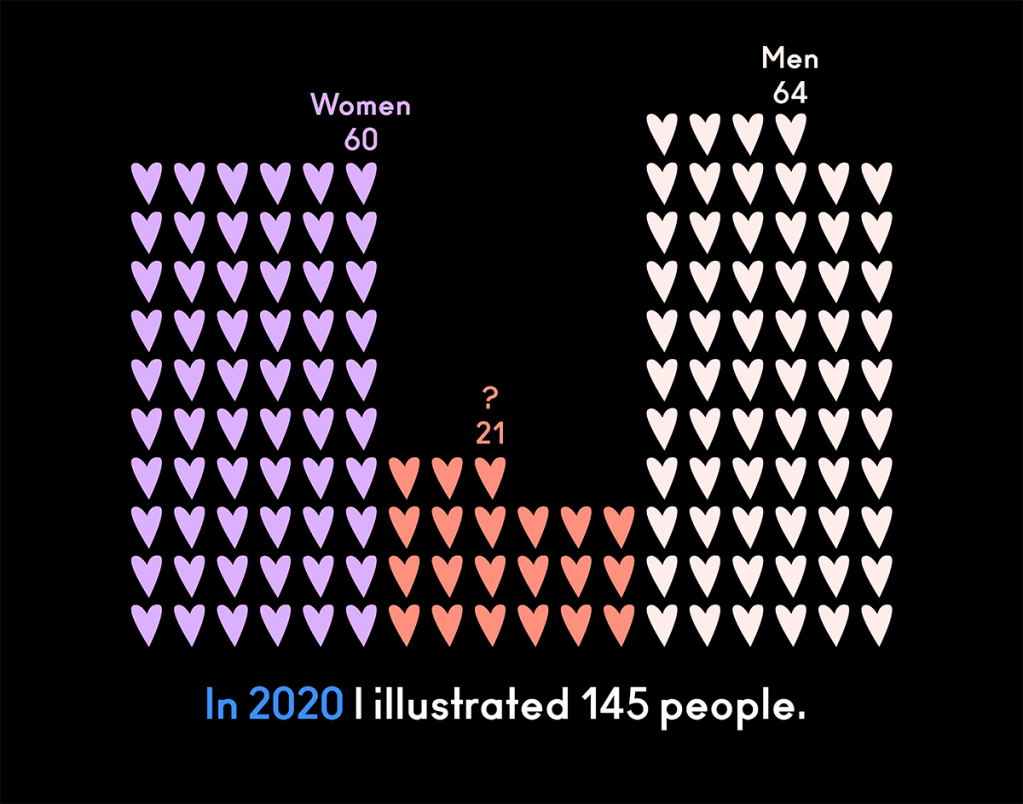
Year 2020 illustrated
My 2020’s numbers illustrated. I did this two years ago, too, and thought it’s time for an update with new numbers of the strange year. Towards new!

